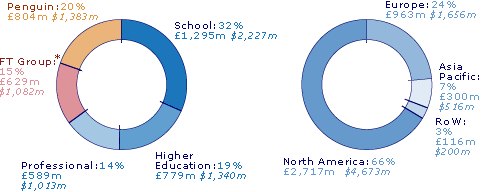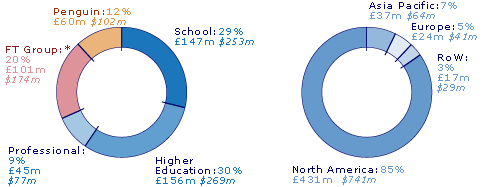

| 2005 | 2004 | Headline Growth % |
Underlying Growth % |
||||
|---|---|---|---|---|---|---|---|
| £M | $M | £M | $M | ||||
| Business performance | |||||||
| Sales - continuing | 4,096 | 7,045 | 3,696 | 6,357 | 11 | 9 | |
| Adjusted operating profit - continuing |
509 | 875 | 400 | 688 | 27 | 22 | |
| Adjusted profit before tax | 422 | 726 | 350 | 602 | 21 | 23 | |
| Adjusted earnings per share | 34.1p | 58.7¢ | 27.5p | 47.3¢ | 24 | 24 | |
| Operating cash flow | 570 | 980 | 418 | 719 | 36 | - | |
| Free cash flow | 431 | 741 | 284 | 488 | 52 | - | |
| Return on invested capital | 6.7% | 6.2% | - | 1.0% pts | |||
| Net Debt | 996 | 1,713 | 1,221 | 2,100 | 18 | - | |
| Statutory results | |||||||
| Operating profit | 536 | 922 | 404 | 695 | 33 | - | |
| Profit before tax | 466 | 802 | 325 | 559 | 43 | - | |
| Basic earnings per share | 78.2p | 134.5¢ | 32.9p | 56.6¢ | 138 | - | |
| Basic earnings per share - continuing |
40.4p | 69.5¢ | 30.8p | 53.0¢ | 31 | - | |
| Cash flow from operations | 875 | 1,505 | 705 | 1,213 | 24 | - | |
| Dividend per share | 27.0p | 46.4¢ | 25.4p | 43.7¢ | 6 | - | |
The profit measures within business performance above are presented on an adjusted basis to exclude: i) other net gains and losses arising in connection with the sale of subsidiaries, investments and associates; ii) amortisation of acquired intangible assets; and iii) short-term fluctuations in the market value of financial instruments (under IAS 39) and other currency movements (under IAS 21). Growth rates are on an underlying basis, excluding the impact of currency movements and portfolio changes. The underlying growth in the return on invested capital represents the constant currency growth.


*Includes IDC.
1. Growth rates are on an underlying basis, excluding the impact of currency movements and portfolio changes. In 2005, currency movements increased sales on a continuing business basis by £46m and profits by £12m, while portfolio changes increased sales by £29m and profits by £9m.
2. Profit measures are presented on an adjusted basis to exclude: i) other net gains and losses arising in connection with the sale of subsidiaries, investments and associates; ii) amortisation of acquired intangible assets; and iii) short-term fluctuations in the market value of financial instruments (under IAS 39) and other currency movements (under IAS 21).
3. The 'business performance' measures, which Pearson uses alongside other measures to track performance are non-GAAP measures for both US and UK reporting. Pearson uses these measures because we consider them to be most useful for tracking underlying business performance. Reconciliations of operating profit, adjusted earnings per share and operating free cash flow to the equivalent statutory heading under IFRS are included in notes 2, 9 and 29 of the governance and financial statements.
4. Dollar comparative figures have been translated at the year end rate of $1.72: £1 sterling for illustrative purposes only.